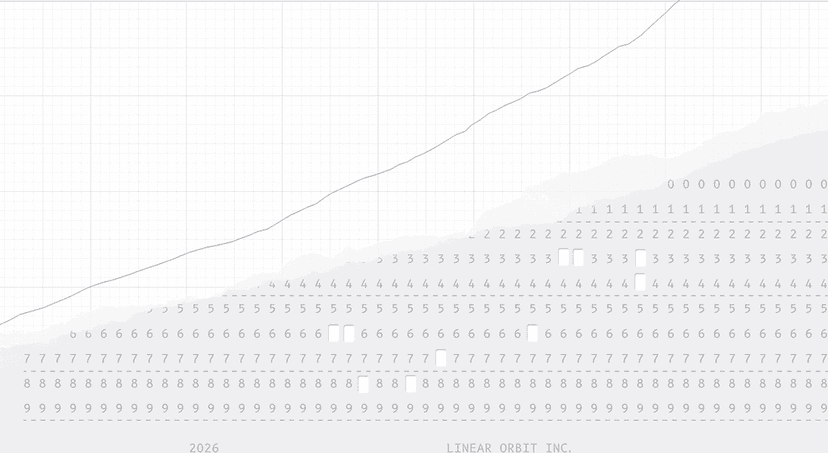
The scary number isn't 46%. It's the one sitting next to it.
Here's the deal: on August 21, Linear published usage data pulled from its own product. The headline is this. In June 2024, fewer than 0.2% of issues created in Linear were written by AI. As of August 2026, it's about 46%.
The weekly absolute volumes make it sharper. Agents create roughly 2,435,000 issues per week. People and integrations create about 2,468,000. That's effectively a tie, and at the current slope it flips soon.
So far, so expected. AI does the work now, we've heard this.
The problem is the number beside it. Between June 2025 and June 2026, time humans spend creating, triaging, and commenting on issues rose across nearly every function. Engineering was up roughly 17% on create-and-triage alone. Founders swung harder still.
AI writes half the issues and human issue work went up. Both sentences are true at once. Linear's own phrasing nails it — AI didn't remove existing work, it added a new layer on top.
Who's who — Linear and "issue tracking is dead"
Linear is an issue tracker. It grew by absorbing startups fed up with Jira's weight and latency. Speed and restrained design are the brand, and it enjoys unusual affection in developer circles.
On March 24, 2026, the company shipped Linear Agent. You assign agents to issues, mention them in comment threads, and describe a recurring job in plain language so an agent runs it on a schedule or in response to events — working from full workspace context.
What made news at launch wasn't the feature. It was the CEO declaring "issue tracking is dead." Bold, coming from the CEO of an issue tracker. The Register and DevClass both put it in their headlines.
This data release is the evidence filing, five months later. And because it's first-party product data, it carries a matched strength and weakness. The strength: these are behavioral logs, not a survey. Nobody was asked "how much do you use AI" — the system recorded events. The weakness: the sample is Linear users, meaning organizations already biased toward aggressive tool adoption.
The sample size is disclosed: 199,000 paid users with known company size, restricted to people active in both January and June 2026. Fixing the cohort like that means the percentages reflect the same people changing, not new signups distorting the ratio.
By function — the biggest jump wasn't engineering
Change in AI adoption between January and June 2026:
| Function | Jan 2026 | Jun 2026 | Change |
|---|---|---|---|
| Product | 12% | 34% | +22 pp |
| Engineering | 12% | 30% | +18 pp |
| Founders | 14% | 30% | +16 pp |
| Design | 6% | 22% | +16 pp |
| GTM (sales/marketing) | 5% | 18% | +13 pp |
Engineering isn't first. Product jumped hardest at +22 pp — 12% to 34% in six months, nearly tripling.
That matters because the AI coding narrative has been developer-centric from the start. "Developers write code faster" was the whole story. The actual data says the functions adjacent to developers are arriving faster. Design went 6% to 22%, close to 4x. GTM went 5% to 18%, more than 3x.
The executive numbers are more dramatic still.
| Role (orgs with 201+ employees) | Jan 2026 | Jun 2026 | Change |
|---|---|---|---|
| CEO | 9% | 36% | +27 pp |
| CTO | 11% | 35% | +24 pp |
CEOs moved more than CTOs, and by June had passed them outright, 36% to 35%. A CEO of a large organization using AI inside an issue tracker would have been hard to picture a few years ago. Issue trackers were for practitioners.
There's a plausible mechanism for the inversion. Coding tools have a learning cost, and engineers already have finely tuned workflows, so inserting a new tool creates real friction. Product and design people were previously stopped by a hard wall — they couldn't touch code at all. When that wall drops, the payoff is much larger. The functions with the biggest adoption jumps are generally the ones that couldn't do the thing before.
The CEO numbers read the same way: to get anything out of an issue tracker, an executive used to have to ask someone. A conversational interface removed that intermediate step. Though there's an alternative reading — executive adoption is especially prone to mixing exploration with real use. Whether 36% still holds six months from now is the actual metric.
The strangest chart — who submits pull requests changed
The output side is more interesting. Over two years, pull requests rose 111%. More than double.
But who opens them shifted.
| Function | Share who opened a PR (2 yrs ago → now) |
|---|---|
| Product managers | 3% → 10% |
| Designers | 1% → 8% |
That's 8x for designers. The absolute numbers are still small, but the direction is unambiguous. Submitting code is leaving the engineer's exclusive domain.
And the team-level comparison is the highlight of the whole report.
| Team type | PRs per week (2 yrs ago → now) |
|---|---|
| Teams using coding agents | 21 → 65 |
| Teams not using them | 8 → 10 |
Agent teams more than tripled, from 21 to 65 per week. Non-agent teams went 8 to 10 — essentially flat. The gap between the groups widened from 2.6x to 6.5x.
One caution reading that table: this data can't tell you which way causality runs. Agents may have raised PR output, or the fast teams that already shipped a lot may have adopted agents first. Probably both. And PR count is throughput, not value. 65 PRs doesn't mean three times better software than 21.
Who gains what — and why did work increase?
The deepest thing in this report isn't the headline. It's the finding that work didn't go down.
Linear's explanation: chatting with AI and delegating issues to agents are categories of work that didn't exist a year ago. They now appear in every function's week. They didn't move into space vacated by old work. They were stacked on top.
Which, structurally, is obvious once you say it. If agents write 46% of issues, somebody has to read them, prioritize them, verify them, and steer them. When creation is automated, review becomes the bottleneck. And review is done by humans.
So Linear's line about "everyone becoming a builder" is only half optimistic. The other half is that everyone is becoming a reviewer. And reviewing is usually less fun than making.
Another thing to be careful about: 46% describes who authored the issue, not how much any issue mattered. Agent-generated issues skew small and repetitive — anomalies spotted in logs, failing tests, dependency bumps. Issues carrying real product direction are still likely written by people. Reading the number as "AI makes half the decisions" overstates it, and the report contains no breakdown of issues by significance.
What Linear gains from this data is clear. The CEO's "issue tracking is dead" line now has a factual basis behind it: the tracker's role is migrating from a human's to-do list to the place where agent work is assigned, reviewed, and controlled. If that framing holds, Linear isn't competing with Jira — it's defining a category.
Has automation ever actually reduced work?
This pattern isn't new. Email is the canonical case. It replaced letters, faxes, and internal mail, dropping the cost of communication dramatically. Did time spent communicating fall? The opposite. Cheaper messages meant vastly more messages, and people ended up spending more time processing them than before.
Compilers and high-level languages tell the same story. The cost of a line of code fell enormously versus hand-written assembly. Did programmers get idle? No — software grew correspondingly in scale and complexity. Economists call the structure Jevons paradox: efficiency gains raise consumption.
There are counter-examples. Automation genuinely eliminated jobs — telephone operators, typesetters, much of the bank teller role. But those share a trait: the work was fully standardized and required no review. Agent-authored issues and PRs aren't there yet. As long as review is required, human work changes shape rather than disappearing.
So what this data shows is neither "AI takes jobs" nor "AI reduces work." It's that the nature of the work is shifting from production to supervision.
It's worth thinking about where that review load lands. Agents create the issues; humans decide when to close them. But review capacity isn't evenly distributed in an organization — it concentrates on the seniors who hold the most context. Triple the creation rate and you triple that concentration. Engineering's 17% rise in create-and-triage time is an early signal of that pressure. Without mechanisms to spread review out — auto-triage rules, confidence-based auto-approval, quality gates on agent output — the load accumulates quietly on a few people.
How competitors respond
Atlassian has a far larger installed base and still dominates the enterprise. But the direction this data implies — agents generating work items and humans reviewing them — sits awkwardly with enterprise workflows. The more approval stages and audit trails an organization has, the worse the bottleneck gets as auto-generated items multiply. If Atlassian solves that with governance features, the weakness inverts into a strength.
GitHub and GitLab come from another angle. They already own issues and PRs, and living in the same place as the code is a structural advantage. Agent work begins and ends in the repository, so the question of whether a separate tracker is needed keeps resurfacing.
General-purpose workspace tools like Notion and Airtable are a variable too. If "every function becomes a builder" is right, the boundary around engineer-only tools blurs, and general tools have an incentive to move in.
The biggest variable is the model companies. Anthropic and OpenAI are both pushing coding agents as first-party products. If agents start managing work as well as doing it, the tracker layer thins. That's probably why Linear is publishing this data now — to claim the position first.
So what actually changes
If you lead engineering — it's time to revisit your productivity metrics. If your dashboard only counts throughput, it can't evaluate a post-AI team. PR counts and issue volume are now inflated by adoption. You need something that distinguishes whether 65 PRs versus 21 is a real performance difference or just finer-grained commits.
If you're a product manager — the share of your function opening PRs went from 3% to 10%. A PM touching code directly is becoming a minority standard rather than an anomaly.
If you're rolling out agents — take the warning in this data seriously. More creation means proportionally more review. Without expanding review capacity, you've just moved the bottleneck onto people.
If you analyze org data — account for the sample bias. These are Linear paying customers, organizations already aggressive about tooling, so read them as running ahead of the industry average.
If you're just a developer — nothing to change today. But it's worth noticing that "person who writes code" is migrating toward "person who judges code an agent wrote." And since that judgment is built by writing a lot of code yourself, this transition is a particularly awkward stretch for junior developers.
If you hire — designers at 8% and PMs at 10% opening PRs means role boundaries are dissolving. Job descriptions written against the old boundaries will start diverging from what teams actually do.
🥄 Three Things You're Probably Wondering
— If AI writes 46% of issues, what happens to jobs? On this data, nothing shrank. Time spent creating and triaging went up. Automating creation made review the new bottleneck. But this is a snapshot; if review gets automated too, the story changes. Too early to call.
— Are agent teams at 65 PRs/week six times more productive? Don't read it that way. PR count is throughput, not value. Agents that slice work finely produce more PRs for the same job. And the causal direction is unclear — fast teams likely adopted agents first.
— Can I apply these numbers to my company? Adjust for bias. The sample is Linear paying customers, skewed toward aggressive tool adopters. The direction is worth noting; using the absolute figures as your own baseline is risky.
Sources
- Linear — AI usage patterns in software teams (2026-08-21, full official data report)
- Linear Changelog — Introducing Linear Agent (2026-03-24, official changelog)
- Linear Docs — AI Agents in Linear (official docs on assigning and mentioning agents)
- Linear Developers — Getting Started with Agents (official agent-building guide)
- The Register — Linear adopts agentic AI as CEO declares issue tracking dead (2026-03-26)
- DevClass — Linear moves sideways to agentic AI as CEO declares issue tracking dead (2026-03-27)
Numbers and criteria are as of announcement and may change.